Custom Map Production
Businesses have unique information needs and, with the importance of location in business, custom maps from Ploughman Analytics convey the right information in a clear, concise, and appealing manner to solve business needs.
Custom maps can:
- Display information useful in day-to-day operations of a business
- Help planners make better decisions involving place
- Impress upon customers, prospects, or investors a firm’s scope of operations and in-depth understanding of an industry
Ploughman Analytics can marshal large quantities of information to produce maps to the specifications of our clients. A custom-produced map can be an eye-catching addition to an office wall or meeting area, illustrating the practice areas of the business or recent trends relevant to growth and expansion. Maps that display geographic data augmented with charts and graphs that further explain the datasets allow for one cohesive product that can be distributed to clients in smaller size, or sent to others outside the organization as an information aid. Ploughman has created professional wall-hanging maps tailored to client needs and labeled with client logos and color schemes.
By helping clients avoid pitfalls of cartography which can cause correct data to be misinterpreted, Ploughman Analytics can help firms end up with a better understanding of their business and make better decisions. For example, data on the number of head of cattle per county on a state-scale map can appear very differently if the map shows total counts in a county vs. counts per square mile:
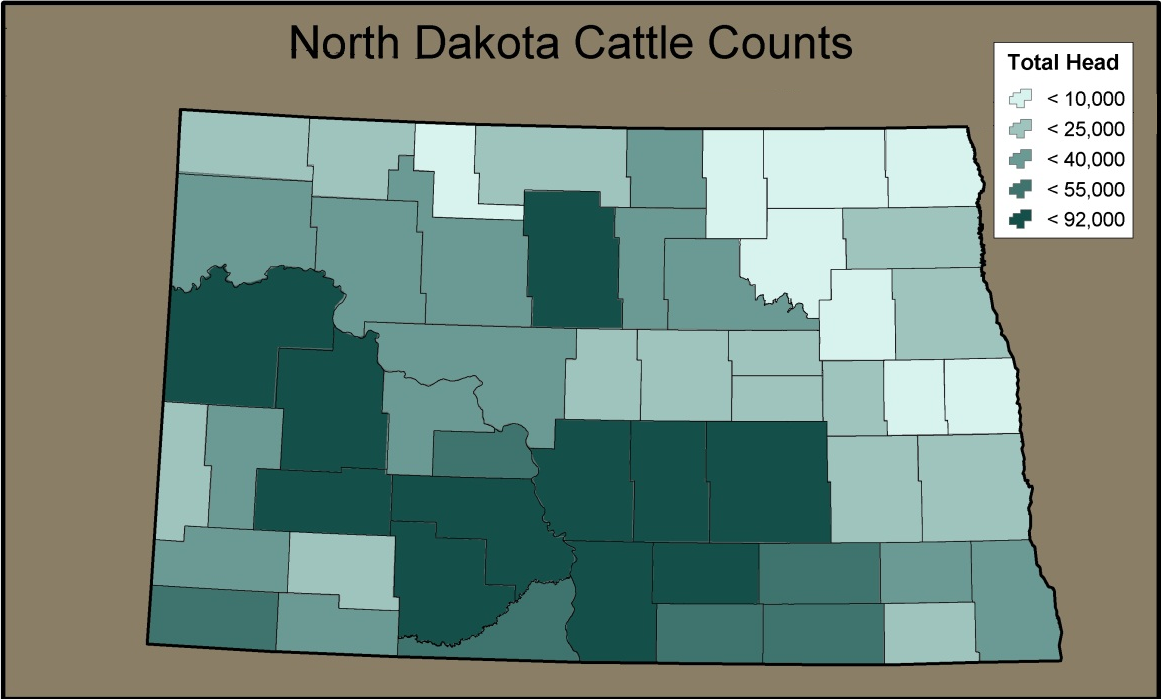
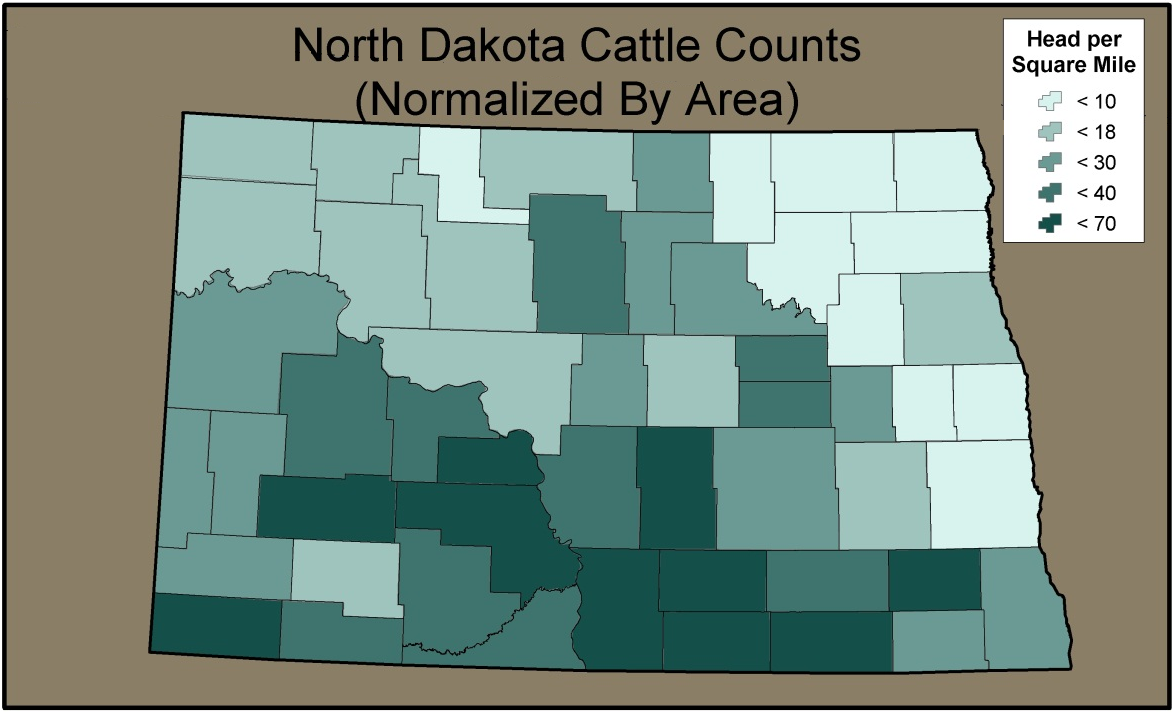
Both were generated from the same underlying data, but the upper image suggests a different story than the lower image at a glance – counties in the western portion of the state have high total counts, while counties in the southeast are lower. Normalized by area, the viewer can see that cattle counts are dense in the southeast and less dense in the west. The county sizes can influence this perception. This applies at large scales like the above, as well as finer-grained maps for small businesses that are concerned with city-level analysis. Without attention to details like this, a map may inadvertently suggest misleading patterns. A business looking to sell goods or services to the cattle industry in North Dakota could target its business development efforts more effectively using a map produced with Ploughman’s cartographic guidance.
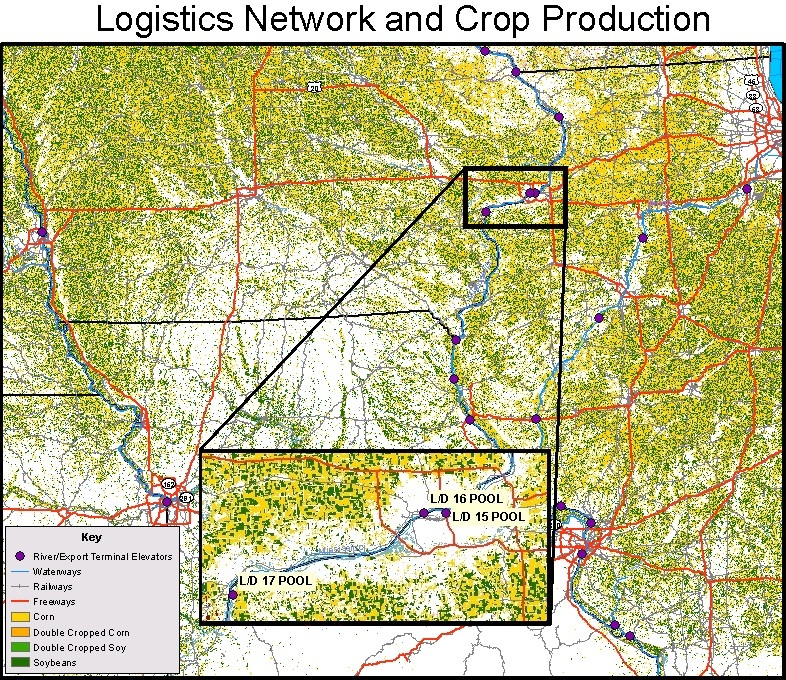
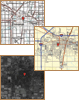
The following example image illustrates how maps can provide an overview of a region with a variety of input data and offer a clear sense of the area that raw numerical data cannot. This map combines crop production data with road and river networks and river terminals to create a comprehensive view of agricultural logistics in the midwestern US.
Custom map formats are also well-suited to information that involves multiple locations; for example, data describing trade flows between countries or traffic flows on street networks. These are best illustrated with spanning markers such as lines and arrows, and Ploughman again observes best practices in cartography to sculpt and position overlaid elements like these to help draw the eye throughout the map rather than overwhelming the viewer.
When these elements are combined, the areas and features of a custom map can inform investors and decision makers, impress clients, and summarize the facets of one’s business operations or market regions.
Ploughman Analytics, Inc.
3309 Cypress Creek Road
Champaign, IL 61822
(217) 693-4000
